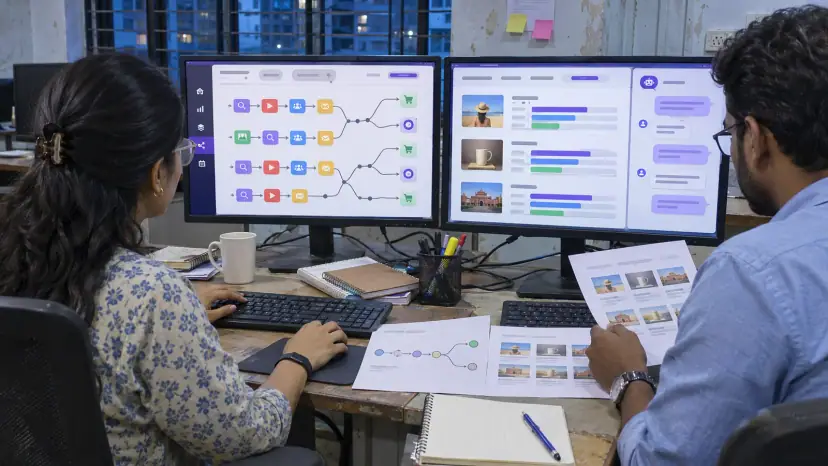
AI marketing analytics brings the data from GA4, ad platforms, your CRM and email tools into one place, then uses machine learning to explain what changed, forecast what comes next and show which campaigns earn revenue. Brainguru sets this up for marketing teams and business owners who have plenty of data but too little time to read it.
Why marketing data is hard to use
Every campaign, click and enquiry leaves a record somewhere. The trouble is that the records sit in different tools, each with its own definitions. Google Ads counts a conversion one way, Meta another, and the CRM knows which leads became customers but not which ad they first saw. Someone ends up copying numbers into a spreadsheet every Monday, and by the time the report is ready the week is over.
The money at stake is real. In Gartner's 2025 CMO Spend Survey, reported by Campaign Asia, average marketing budgets held at 7.7% of company revenue, while half of CMOs reported budgets of 6% or less. With budgets that tight, knowing which spend works matters more than ever.
AI does not fix messy data on its own. What it does well is the repetitive part: joining sources, spotting unusual changes, testing many combinations and writing a first draft of the explanation. People still decide what the business should do next.
What our AI marketing analytics service covers
Most projects combine several of the pieces below. We start with the questions your team asks most often and build from there.
- Unified dashboards: Paid ads, organic search, social, email and CRM data in one view, with the KPIs your team cares about and short written summaries of what moved.
- Forecasting: Models that use past campaigns and seasonal patterns to project leads, acquisition cost and revenue, so budgets can be planned before a campaign starts.
- Customer behaviour and cohorts: Journeys from first visit to purchase, cohorts by acquisition source and lifetime value, and the points where people drop off.
- Campaign performance: Cross-channel views that flag weak ad sets, creative fatigue and spend that brings clicks but no pipeline.
- Competitive and market signals: Tracking of competitor ads, content and search visibility where public data allows it, with benchmarks against your own results.
- Sentiment and brand monitoring: Language models that read reviews, comments and mentions, and alert your team when the tone shifts.
- Revenue attribution: Models that share credit across the touchpoints in a journey, not only the last click.
- Automated reports: Daily, weekly or monthly reports written for each audience, from a one-page summary for leadership to detailed tables for campaign managers.
If your main need is a tool rather than a service, our guide to AI analytics tools for marketing compares the options a small team can run itself.
Data sources we connect
The dashboard is only as good as what feeds it. These are the sources we connect most often:
- Web analytics: Google Analytics 4, plus website and landing page tracking.
- Search and display ads: Google Ads across Search, Display, Shopping and YouTube.
- Social ads: Meta Ads Manager for Facebook and Instagram, and LinkedIn.
- CRM platforms: Salesforce, HubSpot, Zoho and LeadSquared. Brainguru also builds its own CRM, LeadNXT, which connects the same way.
- Email: Mailchimp, Brevo and Klaviyo.
- Social channels: LinkedIn, X, YouTube and Instagram.
- Ecommerce: Shopify, WooCommerce and Magento.
For in-house or older systems, our engineers build API connectors. One limit to plan for: GA4 does not keep detail forever. According to Google's data retention help page, user-level data in a standard GA4 property can be kept for 2 months or 14 months. If you want to compare years of behaviour, the raw data should be exported to a warehouse you control from the start.
How attribution modelling works
Last-click reporting gives all the credit to the final ad or email before a sale. It is simple, but it rewards channels that close and ignores the ones that start the journey. Data-driven attribution looks at many journeys and estimates how much each touchpoint changed the odds of a conversion.
Google already does a version of this. Its GA4 attribution documentation explains that the data-driven model uses machine learning to compare converting and non-converting paths, taking into account factors such as device type, the order of ad exposure and the number of ad interactions. The catch is that GA4 only sees what GA4 tracks. A custom model can add CRM outcomes, offline sales and the delay between first contact and a closed deal, which is where most B2B journeys are decided.
Attribution is an estimate, not proof. A good report states its method, shows how much credit moves between models, and is checked against holdout tests or budget changes where you can run them.
What you get in the dashboard
- Automatic data refresh: Connected channels update on a schedule, so nobody has to paste numbers.
- Written insights: Short summaries of what changed and why it may matter, for readers who do not want to study charts.
- Your KPIs: CAC, ROAS, LTV, conversion rates, pipeline velocity or whatever your business tracks.
- Anomaly alerts: Notices when a metric moves outside its expected range, so problems are seen between reports.
- Journey and attribution views: How each touchpoint contributes to conversions and revenue.
- Cohort and segment analysis: Breakdowns by audience, channel, region, device and your own dimensions.
- Forecasting module: Projections for key metrics, refreshed as new data arrives.
- Exports and scheduling: PDF, Excel or CSV, sent to the right people on a timetable you set.
- Role-based access: Each person sees the data relevant to their job.
- White-label option: Agencies can brand the dashboard for client reporting.
Is your data ready for AI analytics?
Many businesses already hold the raw material. In Twilio Segment's State of Personalization 2024 report, 72% of companies used a customer data platform and 48% used a data warehouse. Having the tools is not the same as having clean data, so we check a few things first:
- Consistent events: The same action, such as a form submission, is named and counted the same way on every page.
- Clean CRM stages: Lead statuses are used consistently, so a "qualified" lead means the same thing to every salesperson.
- Join keys: There is a reliable way to link an ad click, a website visit and a CRM record.
- Enough history: Forecasts need at least one full seasonal cycle to be useful.
Where these are missing, the first deliverable is often a tracking and data clean-up. It is less exciting than a forecast, but nothing downstream works without it.
Common mistakes to avoid
- Too many KPIs: A dashboard with forty charts gets ignored. Pick the few numbers that change decisions.
- Trusting platform-reported conversions: Each ad platform tends to claim the same sale. Reconcile against the CRM or your order system.
- Forecasts without error ranges: A single projected number looks precise but hides uncertainty. Ask for a range.
- Ignoring privacy: Marketing data includes personal data. Collect only what each analysis needs, and keep consent records with it.
AI analytics is now common practice rather than an experiment. The Stanford AI Index 2026 reports that organisational adoption of AI reached 88%, up from the 78% of organisations that the 2025 edition found using AI in 2024. The advantage now comes from how carefully it is applied, not from simply having it.
Data security and privacy
Marketing data is valuable to attackers as well as to you. IBM's Cost of a Data Breach Report 2025 found that the average cost of a data breach in India reached INR 220 million, 13% higher than the year before. We use encryption in transit and at rest, role-based access and data processing agreements, and we limit access to the people working on your project. For India, plan your data handling around the Digital Personal Data Protection Act, 2023, whose main duties start on 13 May 2027.
How a project runs
- Discovery: We list the decisions your team makes each week and the questions the current reports fail to answer.
- Data audit: We check tracking, CRM stages and access, and agree a baseline.
- Build: Connectors, data model, dashboard and the first models, tested against your historical numbers.
- Handover and training: Your team learns to read, filter and question the outputs.
- Ongoing review: Models are retrained as data grows, and reports change as your questions change.
If forecasting revenue is the main goal, see our page on AI for sales forecasting. For tracking rivals, AI for competitor analysis goes into more depth.